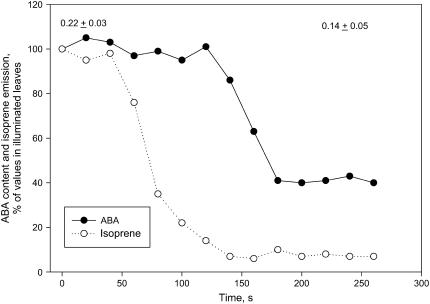
Figure 4.
Time course of changes in ABA content and isoprene emission upon a light-to-dark transition in P. alba leaves. The illumination (1,000 μmol photons m−2 s−1) was switched off at time 0. The values are means of measurements on three leaves of different plants expressed as relative to isoprene emission and ABA content in illuminated leaves (=100). The se of these measurements were always <10% of the respective means. Also shown as means ± se are the values of stomatal conductance at the beginning and at the end of the experiment.

