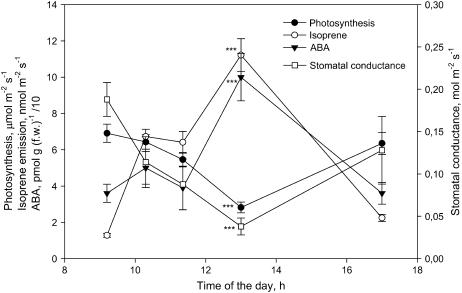
Figure 5.
Time course of changes in photosynthesis, isoprene emission, ABA content, and stomatal conductance during a day in P. alba leaves. The measurements shown are means ± se (n = 4). Asterisks (***) represent statistical separation between means of each parameter measured at 9:30 am and at 1:00 pm (P ≤ 0.01, Tukey's test).

