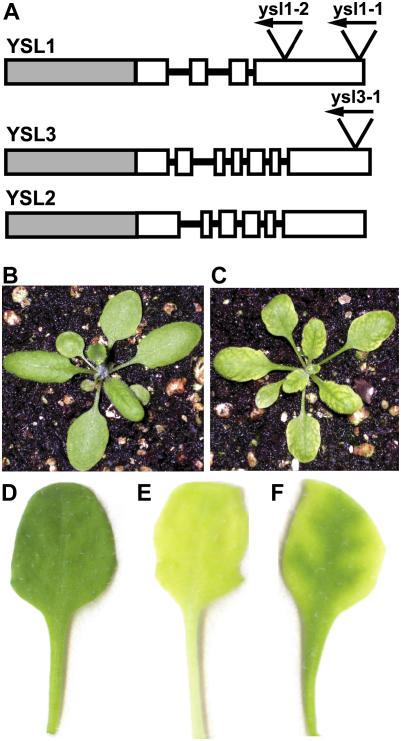
Figure 1.
A, Gene structure of YSL1, YSL2, and YSL3. Gray boxes represent promoter regions, white boxes represent exons, and lines represent introns (not to scale). Insertion sites of T-DNA and orientation are represented by triangles with arrowheads. The insertion in ysl1-1 is within the YSL1 gene but after the translational stop codon. B to C, Three-week-old soil-grown plants. B, Col-0 control plant. C, Typical ysl1ysl3 mutant. D to F, Typical leaves of MS agar-grown plants 18 d after planting. D, Col-0 control leaf. E, Col-0 leaf from 18-d-old plant that was transferred to −Fe MS agar on day 14. F, Typical leaf of ysl1ysl3 grown on complete MS agar.

