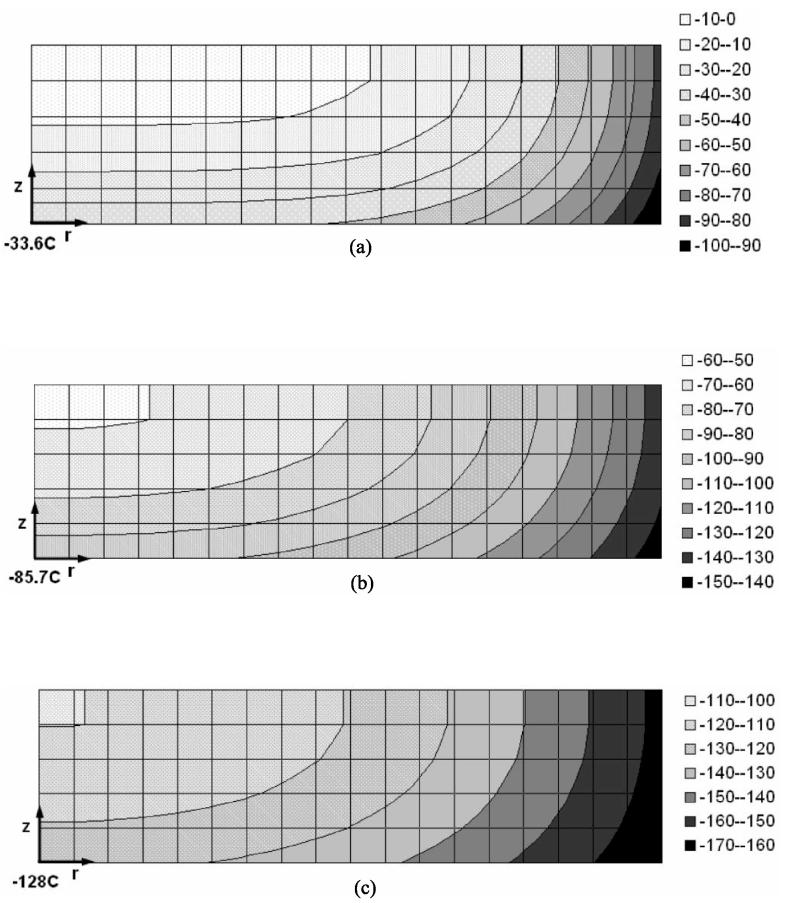
Figure 5.
Simulated temperature distribution in the cryoprotectant in experiment #41 (corresponds to Fig. 2), when the temperature sensor reads: (a) −33.6°C, (b) −85.7°C, and (c) −128.0°C. The temperature field is axi-symmetric, where the center line coincides with the left side of each map, and the point of measurements is the bottom-left corner. The simulation includes the cryoprotectant, vial, and thermal insulation sleeve, however, the temperature map shows the cryoprotectant only.

