
Figure 6.
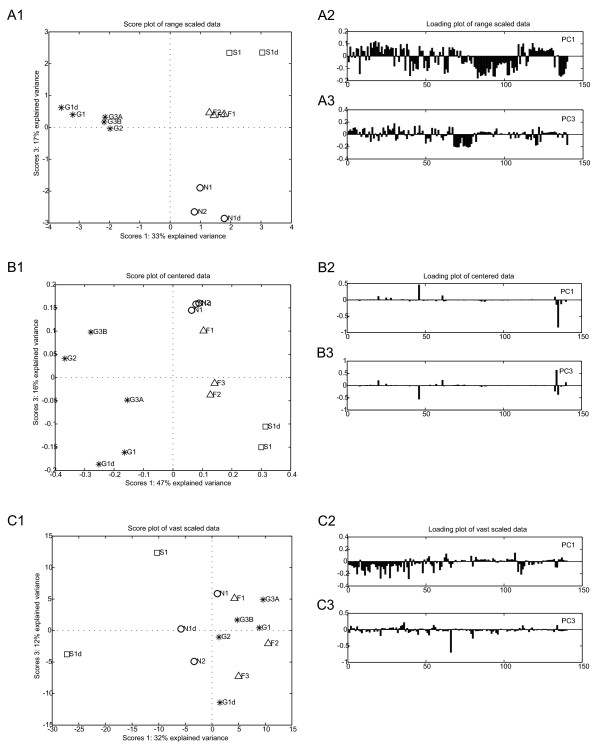
Effect of data pretreatment on the PCA results. PCA results of range scaled data (6A), centered data (6B), and vast scaled data (6C). For every pretreatment method the score plot (X1) (PC1 vs. PC2) and the loadings of PC 1 (X2) and PC 2 (X3) are shown. D-fructose (F, △), succinate (S, □), D-gluconate (N, ◯), D-glucose (G, *).