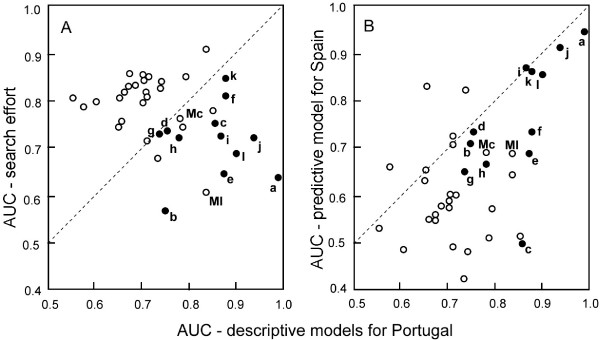
Figure 5.
Fit of ecographical models for Iberian amphibians and reptiles under different modelling conditions. Bivariate plot of AUC-values, displaying the fit of distribution models for 12 edge species (solid dots, species codes as in Figs 1 and 2) and 26 countrywide species in Portugal (open dots, Mc = Macroprotodon cucullatus, Ml = Mauremys leprosa). A) Descriptive fit for models obtained with 13 environmental variables available for selection (horizontal axis) and only search-effort available for selection (E', vertical axis). Note the difference between edge- and countrywide species that have on average higher scores along the horizontal and vertical axis, respectively. B) Descriptive model fit (precision, horizontal axis, as in A) versus the fit of models extrapolated over Spain (accuracy, vertical axis). Note that precision and accuracy are significantly associated for edge species, but not for countrywide species. For statistical numerical detail see text.

