
Figure 5.
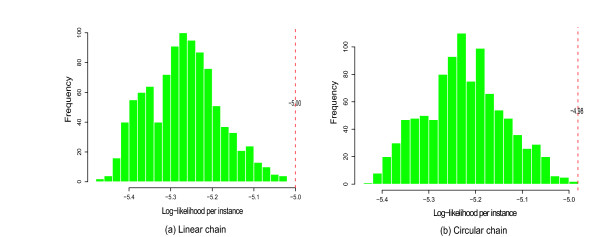
Modeling TFBS V$AP1_Q4_01. The performance of the optimized model of TFBS V$AP1_Q4_01. The histogram is the log-likelihood score distribution of 1,000 randomly permuted mixture models. The red reference line indicates the relative performance of the DNJ optimized model (a) 0–1 mixture linear model (b) 0–1 mixture circular model.