
Figure 8.
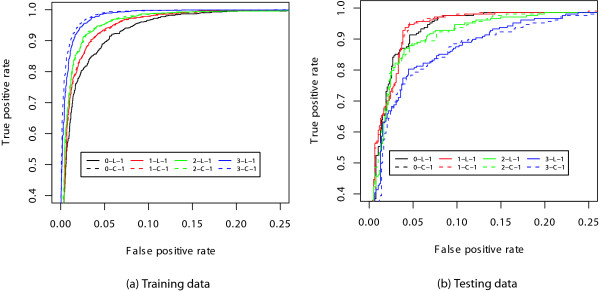
Comparison of different 0-k mixture models for donor splice site prediction. Comparison of different 0-k mixture models for donor splice site prediction by ROC curves. Based on the Area Under Curve (AUC) criterion, the figure indicates that: (a) For training data, the best models were 3-L-1 and 3-C-1 while the worst model is 0-L-1 (same as 0-C-1). (b) For testing data, the best models were 1-L-1 and 1-C-1 while the worst models are 3-L-1 and 3-C-1.