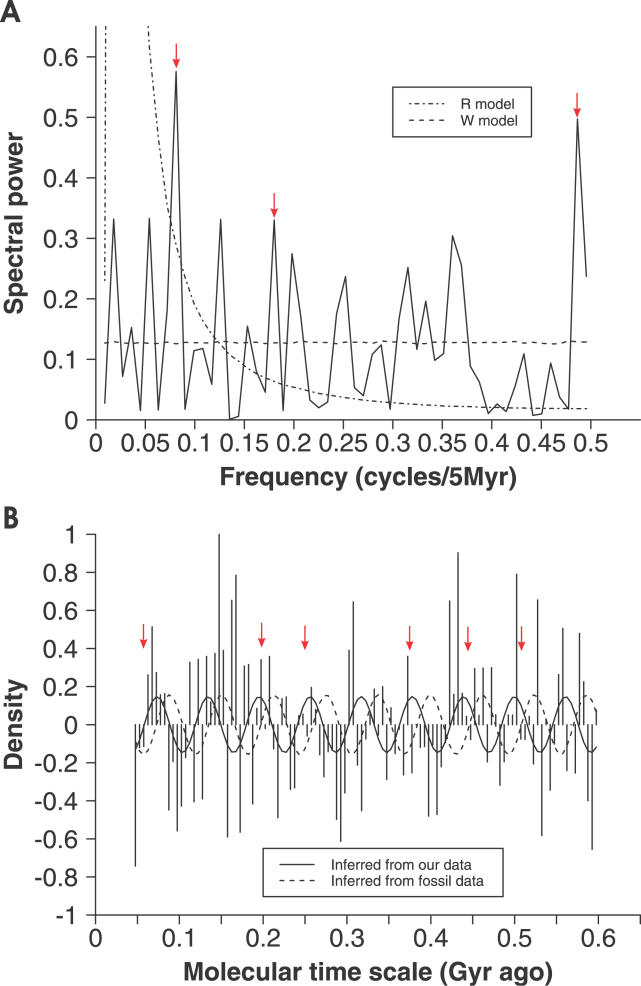
Figure 4. Periodogram Analysis of the Density Trace of Transmembrane Gene Duplicates during the Phanerozoic Phase.
(A) Fourier spectrum of the detrended density trace of the transmembrane gene duplicates during the Phanerozoic phase. Dot-dashed line (R model) and dashed line (modified W model) are estimates of spectral background [7]. The arrows indicate three potential peaks (Table S3), which are of statistical significance in finding the indicated peak at the specified period in either model, and accounts for at least 5% of the variance (i.e., biological significance cutoff) in the diversity signal.
(B) The detrended density trace of the transmembrane gene duplicates during the Phanerozoic phase with a 62-Myr sine wave inferred from fossil data (solid line) [7] and a superimposed 61-Myr wave from our data (dashed line). The arrows indicate the times of major extinctions [5].

