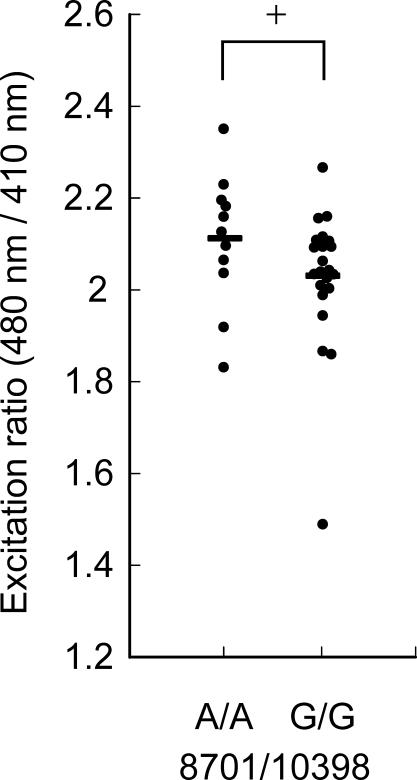
Figure 4. Peak Cytosolic Calcium Level after Histamine Stimulation in Cybrids with 8701A/10398A and 8701G/10398G .
The values of two cybrids with 8701A/10398G were 1.92 and 2.20. For each cybrid, data taken from 11–42 cells (average, 26 cells) were averaged. The y axis shows the ratio of the 525 nm fluorescence at 480 nm to that at 410 nm. Horizontal bars indicate the mean values for each type of cybrid. +p = 0.08 (Mann-Whitney U test).

