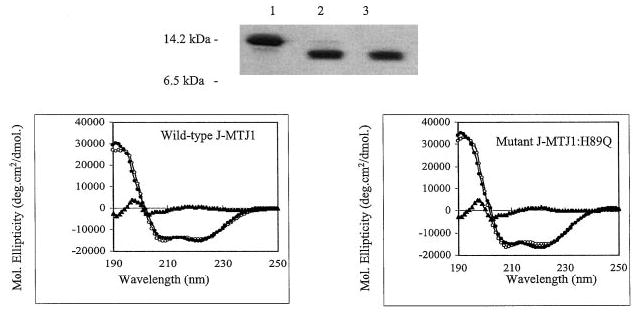
Fig. 3. Purification and characterization of the J domain of MTJ1.

Top panel, 15% SDS-PAGE analysis of His6-J-MTJ1 before and after cleavage by thrombin. Lane 1, uncleaved His6-J-MTJ1; lane 2, cleaved J-MTJ1; lane 3, purified cleaved J-MTJ1 not retained by the metal-chelating resin. Bottom panel, far-UV CD spectra of J-MTJ1 wild-type (left panel) and J-MTJ1:H89Q mutant (right panel). The protein concentrations were 11 and 8 μm for the wild-type and the mutant, respectively, in 10 mm sodium phosphate, pH 7.0. The open circles, the closed circles, and the closed triangles represent the experimental data, the fitted data (as calculated by the JFIT method), and the difference between experimental and fitted data, respectively.
