
Fig. 7.
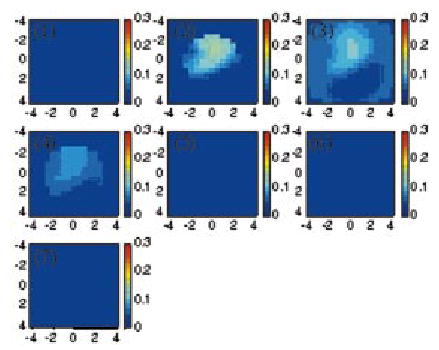
Reconstructed optical absorption map at 660 nm. The slices were from 0.7 cm underneath the skin to the chest wall with 0.5-cm spacing. For each slice, the horizontal and vertical axes are X and Y, respectively, with the spatial dimensions of 9 × 9 cm. The lesion appears in slice 2, 3, and 4.