Figure 1.

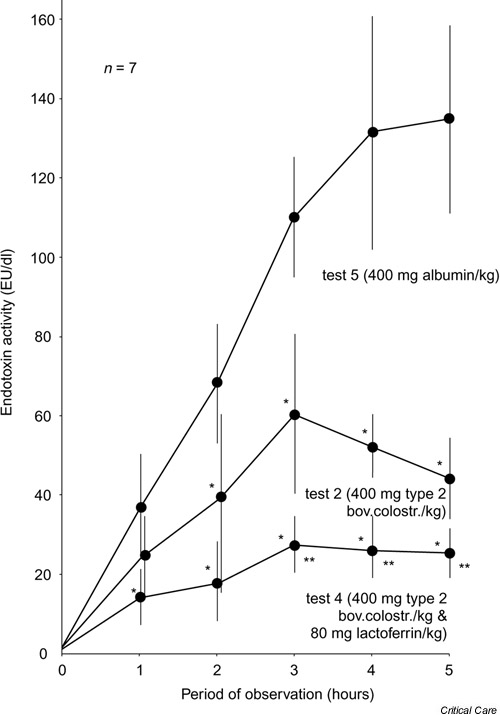
Mean values and standard deviations of plasma endotoxin activity in experimental group 2 (test 2) and 4 (test 4), and in control group 5 (test 5). *P < 0.05, versus control group; **P < 0.05, versus group 2.

Mean values and standard deviations of plasma endotoxin activity in experimental group 2 (test 2) and 4 (test 4), and in control group 5 (test 5). *P < 0.05, versus control group; **P < 0.05, versus group 2.