
Figure 1.
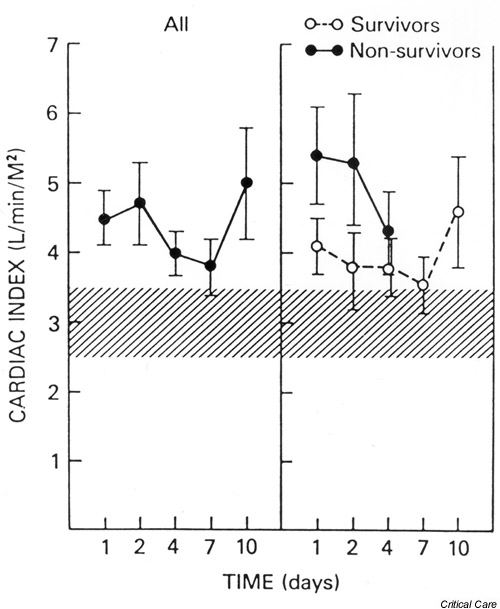
The mean (± SEM) cardiac index plotted against time for all patients, survivors, and nonsurvivors. The hatched areas show the normal range. All groups maintained an elevated cardiac index throughout the study period. The difference between the survivors and nonsurvivors was not statistically significant. Reproduced with permission from [16].