
Figure 3.
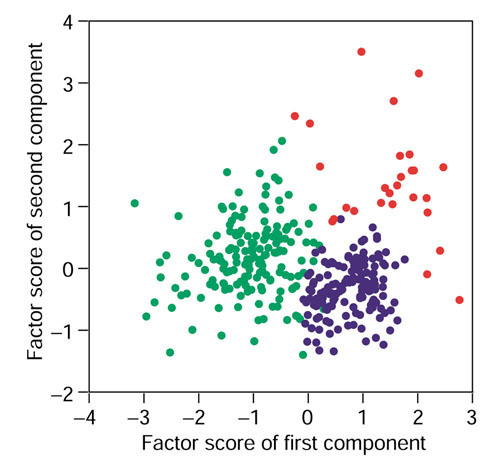
Parametric clustering of genes using the Gaussian mixture model. The dots represent a two-dimensional matrix of genes generated by principal component analysis of the gene-expression data. Horizontal axis, factor score of the first component extracted from the expression patterns of each gene; vertical axis, factor score of the second component. Green, group GM-A; blue, group GM-B; red, group GM-C.