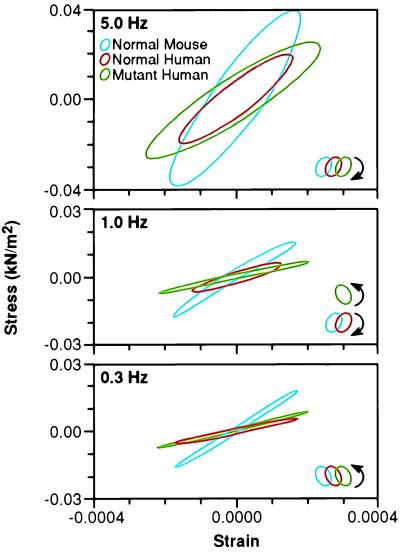
Figure 3.
Smoothed work loops from raw data of fiber stress versus strain (normalized tension vs. fractional change in length) during sinusoidal length oscillations of representative normal, control human, and mutant mouse papillary muscles at three frequencies. Raw saved data was digitally filtered at 16× the driving frequency to reduce electrical noise (primarily 60 Hz). Data is shown at each frequency for the three types of muscle bundles. The muscle bundle type and direction of the work loop are identified by color and arrows respectively, in the legend. In the top panel are loops during 5.0 Hz oscillations showing that, at this frequency, all muscle bundles absorb work from the driving apparatus. The clockwise rotation of the loops indicates that, during shortening, the force exerted is lower than during lengthening. In the middle panel, at 1.0 Hz, only the mutant human bundle performs work on the driving apparatus, as indicated by the counter-clockwise rotation. In the bottom panel, at 0.3 Hz, all three bundles traverse a counter-clockwise loop, indicating the production of work, although the mutant loop is so narrow as to hardly produce any work at all.

