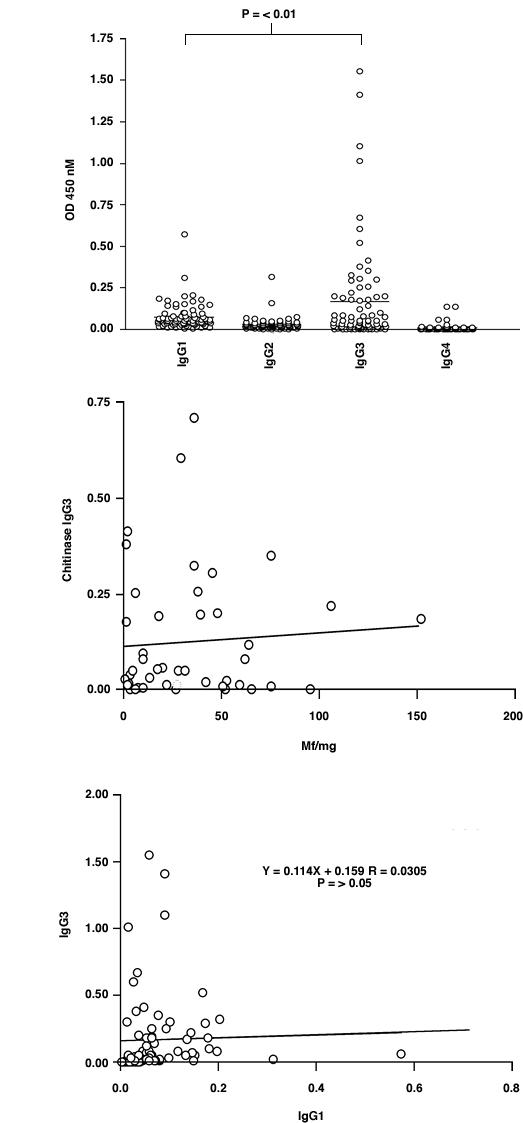
Figure 2.

IgG subclass analysis by ELISA on Ov-CHI-1 full-length antigen using 77 selected sera (see text). The whole profile of IgG1-IgG4 responses is shown in Figure 2A. Figure 2B shows the relationship between microfilarial skin density and anti-Ov-CHI-1 IgG3 level in these sera. The relationship of IgG1 with IgG3 is shown in Figure 2C.
