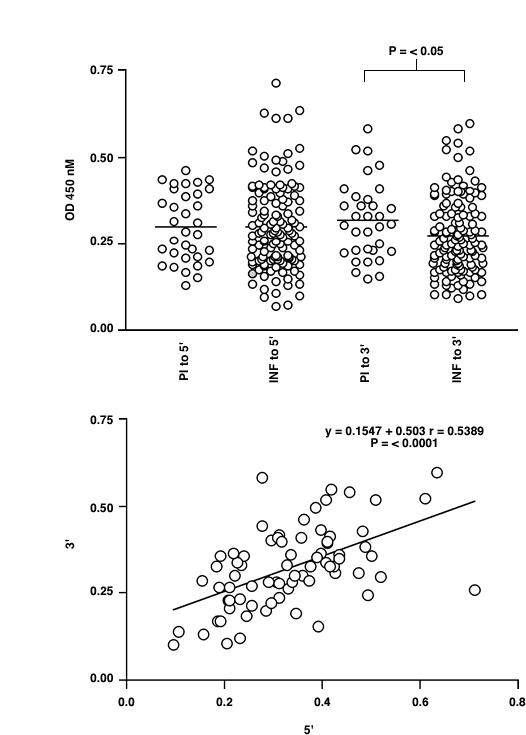
Figure 4.

ELISA analysis of the IgG response to recombinant Ov-CHI-1 5' or 3' antigen in human onchocerciasis. Figure 4A: Comparison of the response in the sera of infected (INF) and putatively immune (PI) individuals. Figure 4B: The relationship of response to 5' antigen and 3' antigen for individual sera. The line of liner regression is shown for data sets in which there is a statistically significant correlation between responses to the two antigens (determined by Spearman's Rank Correlation Coefficient).
