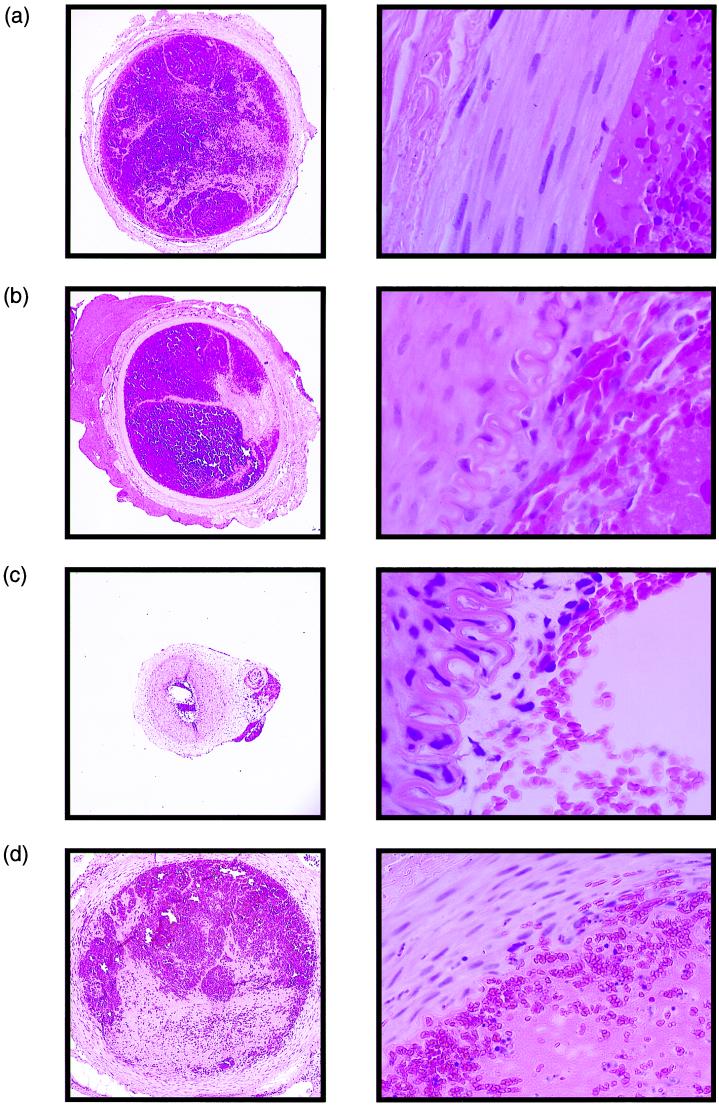
Figure 5.
Representative low (×5; Left) and high (×50; Right) magnification photographs of cfa cross sections 3 days after thrombus initiation for animals treated with buffer alone (a), 200 μl of 5 × 10⁹ pfu/ml Adv/RSV-βgal (b), 200 μl of 5 × 10⁹ pfu/ml Adv/RSV-tPA (c), or accelerated systemic infusion of rtPA at the time of thrombus initiation (d).

