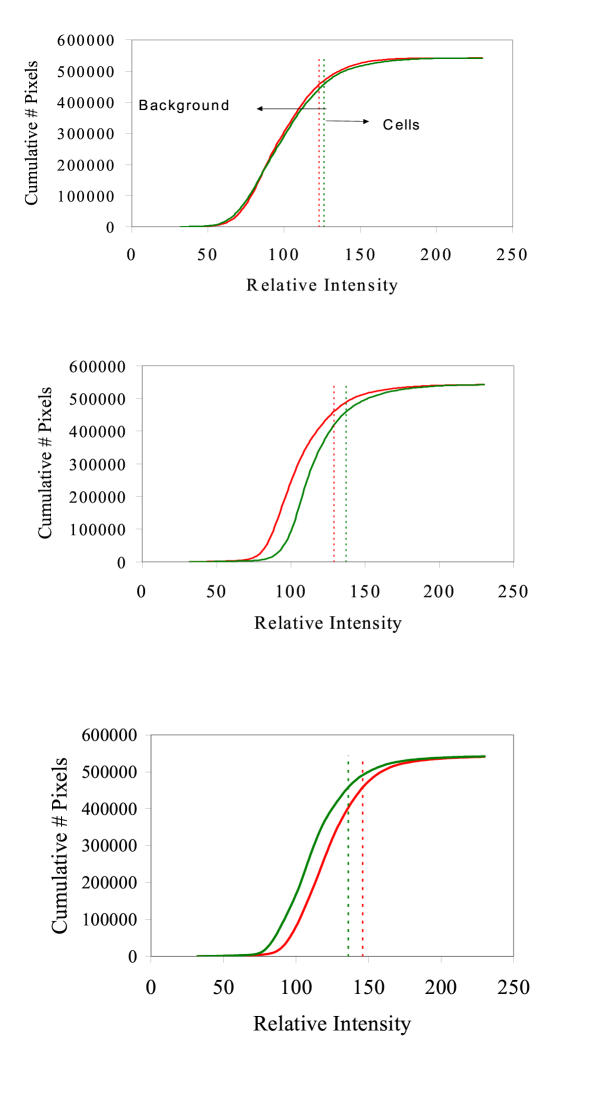
Figure 2.
Computer generated cumulative histograms corresponding to the histograms seen in Figure 1. The red and green dotted lines demarcate the 85th percentile of pixels, which was used as the threshold level for pixel intensity. This threshold intensity, shown in both Figures 1 and 2, was used to differentiate between the background pixels (to the left of the line) and the cell pixels (to the right of the line).

