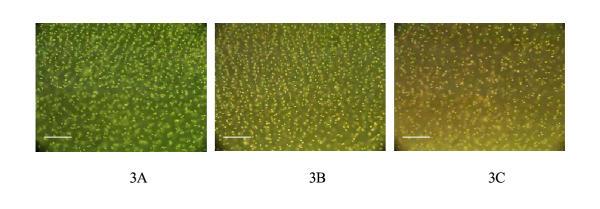
Figure 3.
Digitised images of the three different cartilage slice sections from which the histograms in Figures 1 and 2 were generated. These images demonstrate what the human evaluators saw when attempting to quantitatively assess the distribution of red and green cells. The white line in the bottom left corner represents 100 μm.

