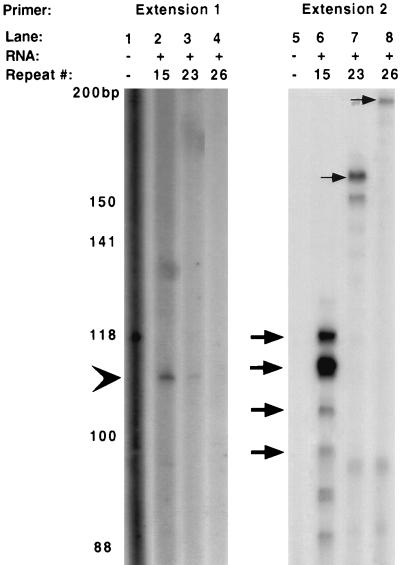
Figure 4.
Primer extension on strain 12 derivatives containing different numbers of repeats, comparing the effect of increasing repeat number on P1 and P2. The gel was loaded as follows: lanes 1 and 5, reactions without RNA; lanes 2 and 6, reactions using RNA from 12Δhmw1p with 15 repeats; lanes 3 and 7, reactions using RNA from 12.234Δhmw1p with 23 repeats; lanes 4 and 8, reactions using RNA from 12.234Δhmw1p with 26 repeats. The samples in lanes 1–4 were analyzed for P1 levels by using the primer designated extension 1, and samples in lanes 5–8 were analyzed for P2 levels by using the primer designated extension 2. The arrowhead shows the location of P1. The large arrows show the ladder of P2 products separated by single repeat units. The smaller arrows show the location of P2 in the isolates with 23 and 26 repeats, respectively. The minor bands at 95 bp in lanes 7 and 8 are most likely artifactual, because they would imply transcription initiation well within the repeat region, and they are absent when primer extension is performed with other primers (not shown).

