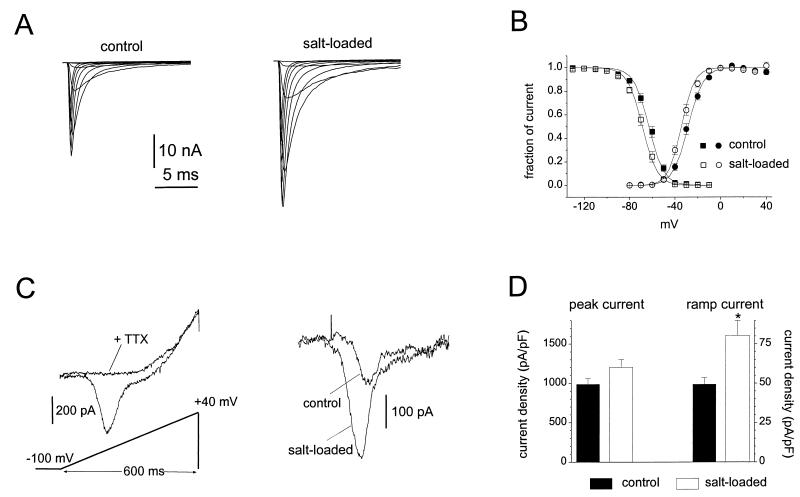
Figure 4.
Comparison of Na+ currents in control and salt-loaded SON neurons. (A) Family of traces from representative SON neurons freshly isolated from control (Left) or salt-loaded (Right) rats. The currents were elicited by 40-ms test pulses to various potentials from −60 to 30 mV. Cells were held at −100 mV. (B) Normalized activation (circles) and steady-state inactivation (squares) data for control (filled symbols; n = 17) and salt-loaded (open symbols; n = 17) neurons. Curves through the points are fits to Boltzmann functions. For activation the V1/2 and k values were −28.5 ± 1.4 and 6.7 ± 0.3 mV for control MNCs and −34.4 ± 1.2 and 5.8 ± 0.2 mV for salt-loaded MNCs. For inactivation the V1/2 and k values were −62.9 ± 1.3 and 6.6 ± 0.2 mV for control MNCs and −68.6 ± 1.4 and 6.5 ± 0.2 mV for salt-loaded MNCs. Steady-state inactivation was measured with 500-ms inactivating prepulses. Cells were held at prepulse potentials over the range of −130 to −10 mV prior to a test pulse to 0 mV for 20 ms. Error bars indicate SE. (C) Ramp currents are elicited in MNCs by slow voltage ramps (600-ms voltage ramp extending from −100 to +40 mV). Left shows the ramp current in a salt-loaded MNC before and after the addition of 250 nM TTX to the extracellular solution. TTX blocks the ramp current. Right shows the TTX-sensitive ramp currents in representative control and salt-loaded MNCs. Leak currents recorded after application of 250 nM TTX were subtracted. (D) The peak and ramp current densities (estimated by dividing the maximum currents by the cell capacitance) are larger in salt-loaded neurons (n = 29) than in control neurons (n = 34); note that the increase is proportionately greater for the ramp currents. Error bars indicate SE, and the ∗ indicates P < 0.005.

