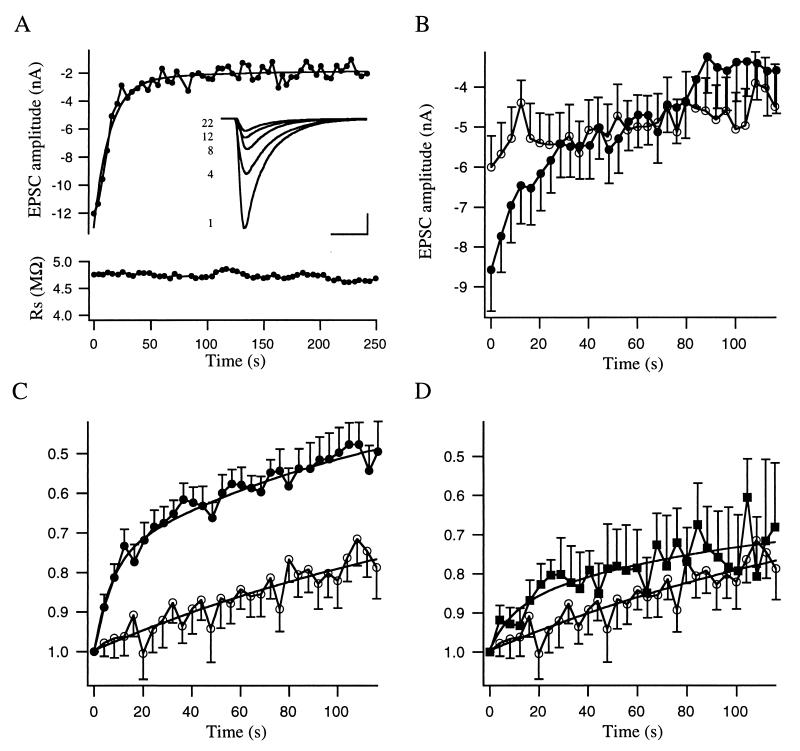
Figure 4.
Initial EPSC amplitudes are increased in msec7-1-containing synapses. (A) Representative experiment of an msec7-1-containing synapse. Trains of six action potentials were elicited on the nerve cell soma, and the resulting EPSCs were recorded from the innervated muscle cell. Data points represent the average amplitude of the EPSCs obtained during each train. The apparent fast rundown in amplitude is also evident from raw traces of first EPSCs in the indicated trains (Inset). (Bars = 5 ms and 5 nA.) The lower panel illustrates the series resistance values recorded from the muscle cell during the experiment. (B) Averaged, absolute EPSC amplitudes of control (open circles; n = 27) and msec7-1-containing synapses (filled circles; n = 26). Each data point represents the mean value of six EPSC amplitudes obtained during each train averaged for all experiments. (C) Same data as in B normalized to the first amplitude. The rundown in msec7-1 neurons has time constants of 15.7 and 125 s whereas in control cells the rundown is much slower and could be fitted with one exponential with a time constant of 180 s. (D) Comparison of averaged EPSC amplitudes, normalized to the first amplitude, of control (open circles; n = 27) and msec7-1-mut-containing synapses (filled squares; n = 13). Notably, no statistically significant difference in rundown of EPSC amplitudes could be observed between control and msec7-1-mut cells. Error bars are given as SEM.

