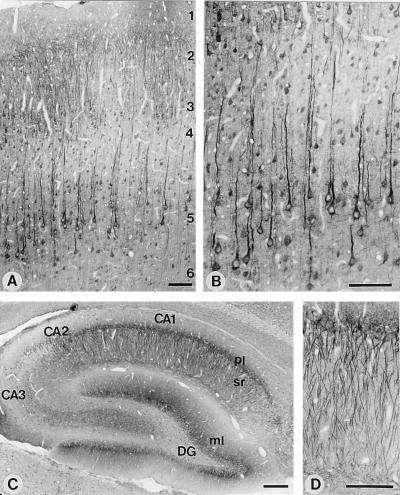
Figure 2.
Light-microscopic localization of neuroligin 1 in rat brain. Shown are sections of the overall neocortex (A) or of layers 4 and 5 of the neocortex (B). Numbers indicate cortical layers. Low-magnification view of the entire hippocampal formation (C) or high-magnification view of the apical dendrites of pyramidal neurons from the CA1 region (D). DG, dentate gyrus; ml, molecular layer; pl, pyramidal cell layer; and sr, stratum radiatum. All sections were stained with antibody 4C12 and developed by using horseradish peroxidase-labeled secondary antibodies. [Bar = 100 μm (A, B, and D) or 250 μm (C).]

