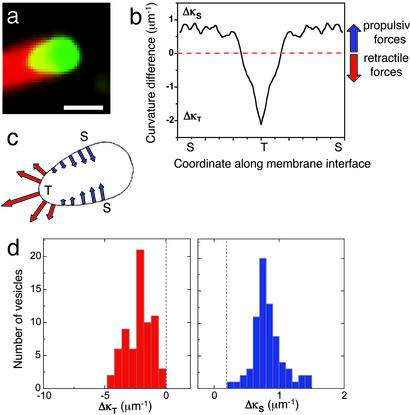
Figure 2.
Spatial distribution of forces on a deformed vesicle. (a) Fluorescence image of the typical teardrop shape assumed by a moving vesicle deformed by actin. The color scheme is the same as described for Fig. 1. (Scale bar, 3 μm.) (b) Plot of the curvature difference between the spherical cap and a point on the vesicle surface as a function of the spatial coordinate along the vesicle surface. T and S denote the tip of the trailing edge and the sides of the vesicle, respectively. The curvature difference goes from a maximum negative value at the trailing end ΔκT to a smaller positive value ΔκS at the sides. The noisy appearance of the curvature profile is due to numerical estimation from a digitized image. (c) Contour of the vesicle, the curvature of which is shown in b. The arrows represent the stress at the membrane–actin interface; the relative sizes of the arrows are proportional to the magnitudes of the curvature difference, and the direction of the arrows indicates the direction of the stress experienced. (d) Histograms showing the maximum positive and negative curvature differences occurring on the tip of the trailing end and the vesicle sides, respectively, of 50 deformed vesicle shapes.

