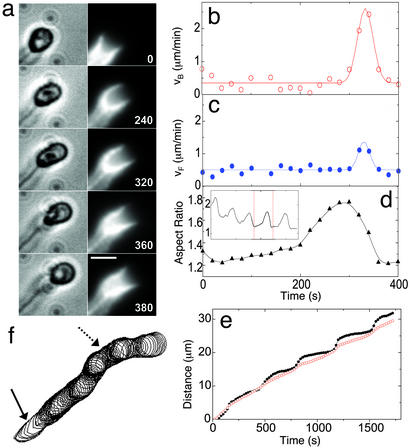
Figure 3.
Dynamics of the elongation and release of a vesicle from the actin gel. (a) Time sequence of phase-contrast (Left) and fluorescence (Right) images of a vesicle going through a slow-elongation and rapid-release phase. Phase-contrast images show the vesicle and a trailing comet tail. Fluorescence images show the intensity of rhodamine-actin in gray scale. The actin cup elongates from an initial shallow shape and creeps around the vesicle, becoming shallow again as the vesicle appears to be released suddenly from the cup and becomes spherical. The time elapsed in seconds is shown on the bottom right corner of the fluorescence images. (Scale bar, 3 μm.) (b and c) Instantaneous velocity of the back (VB) and front (VF) of the moving vesicle as a function of time. Time-lapse images acquired at intervals of 20 sec were used to quantify the velocity and shapes. The solid lines are a guide to the eye. (d) Aspect ratio of vesicle shape as a function of time. Aspect ratio is defined as the maximum length divided by the maximum width perpendicular to the length. The highest velocity occurs just after the vesicle reaches its maximum length. (Inset) Aspect ratio of a vesicle that repeats the elongation–relaxation cycle several times. The vertical dotted lines indicate the part of the time series that is shown in greater detail in d. (e) The distance traveled by the front (open circles) and back (filled circles) of a stepping vesicle, as a function of time. (f) Overlay of vesicle contours from phase-contrast images at successive time steps (20-sec intervals) of motion, showing oscillations in velocity. In regions where the contours are further apart (solid arrow), the trailing edge of the vesicle moves rapidly; regions of densely packed contour lines (dashed arrow) depict slower forward motion during vesicle elongation.

