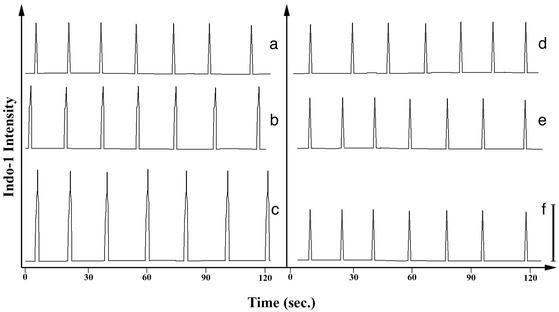
Figure 3.
Intracellular calcium concentration. Cells were preloaded with indo-1AM. Cells were placed on coverslips, then observed by using fluorescence microscopy. A photomultiplier tube attached to a Zeiss microscope was used to quantify the fluorescence intensity. Calcium spikes are observed in both WT and mutant FcγRIIA (a and d, respectively). Calcium spikes were also observed in cells after phagocytosis of one (b and e) or two (c and f) targets. Transfectants expressing WT FcγRIIA exhibited increases in calcium spike intensity after phagocytosis of IgG-opsonized targets (b and c). However, cells expressing FcγRIIA (AAA) did not display this increase in calcium amplitude (e and f). The bar at the lower right represents the calcium signal amplitude obtained in cells expressing WT FcγRIIA containing one internalized target.

