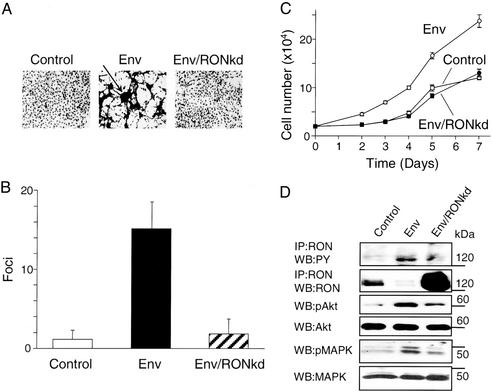
Figure 2.
Reversion of Env-induced transformation of BEAS-2B cells by stable expression of RONkd. BEAS-2B cells were transfected with equal amounts of the following plasmids: Control, pCR3.1 and pMSCV-puro-EGFP; Env, pHA-Jenv and pMSCV-puro-EGFP; Env/RONkd, pHA-Jenv and pMSCV-puro-RONkd. Transfected cells were cultured in the presence of G418 and puromycin to select for the expression of both plasmids. (A) Cells photographed 6 weeks after transfection. The arrow indicates a focus of Env-transformed cells. (B) Control, Env, and Env/RONkd cells were fixed and stained with Giemsa dye, and foci were counted by using a microscope. Bars represent the number (mean ± SE) of foci counted in 25 fields (×16 magnification) in three independent experiments. (C) Cells were seeded at 2 × 10⁴ cells per well in duplicate wells of 24-well plates. Cell numbers were measured at the indicated time points by using a 3-[4,5-dimethylthiazol-2-yl]-2,5-diphenyltetrazolium bromide (MTT) cell-growth determination kit (Sigma). The number of cells was determined from an MTT calibration curve generated for each cell line. Each experimental point represents the mean ± SE of three independent experiments. (D) RON, Akt, MAPK, and their tyrosine-phosphorylated forms were detected as described for Fig. 1. The intensity of the RON bands is noticeably less in the Env-transformed cells as compared with Fig. 1C because of rapid turnover and recycling of activated RON during continuous culture of transformed cells. The dense RON band in Env/RONkd cells represents overexpressed RONkd. The positions of molecular mass markers are indicated at right. IP, immunoprecipitated; WB, Western blot.

