Figure 2.
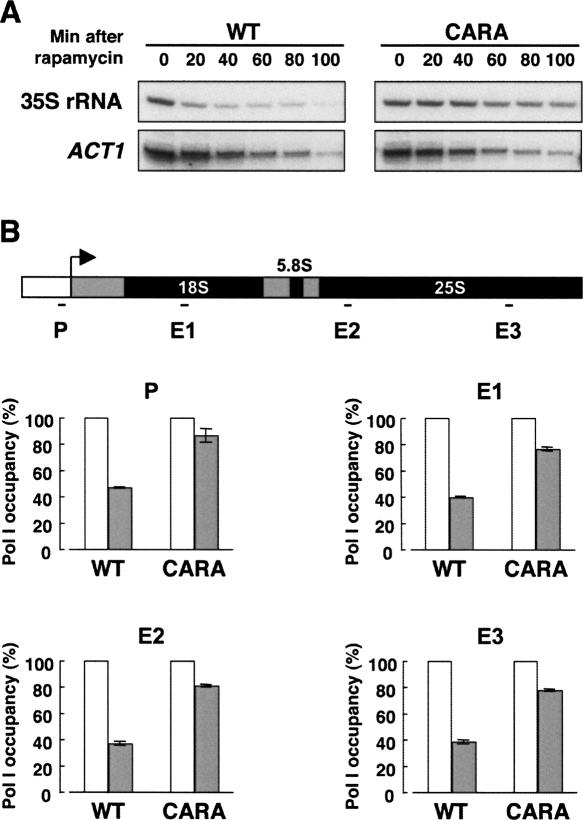
In vivo deregulation of Pol I transcription in CARA cells. (A) Primer extension analyses of 35S rRNA and ACT1 mRNA. Wild-type (WT) or CARA cells were grown in rich medium to mid–log phase and rapamycin was added (t = 0 min). At the indicated times, the same number of cells were harvested, total RNAs were extracted, and the amount of 35S rRNA and ACT1 mRNA was determined by primer extension analysis. The decrease of the 35S rRNA level is attenuated in CARA cells compared with WT cells (see quantification in Supplemental Fig. S6), whereas the ACT1 mRNA level is identical in the two strains. (B) ChIP analysis of the occupancy of the 35S rDNA by Pol I. Chromatin extracts were prepared from the same number of WT or CARA cells grown in rich medium to mid–log phase either in the absence of rapamycin (white histograms) or after a 20-min rapamycin treatment (gray histograms). ChIP experiment was performed using anti-A190 antibodies. Quantification was performed by Real-Time PCR, and the occupancy of the 35S rDNA by Pol I at the promoter region (P) or along the transcribed region (E1 [+1430, +1536], E2 [+3551, +3657], and E3 [+5648, +5740] as indicated) after the rapamycin treatment is represented as a percentage of the occupancy without rapamycin. Standard deviation is calculated from two independent experiments. During the rapamycin treatment, the decrease of Pol I occupancy of the 35S rDNA is attenuated in CARA cells compared with WT cells.

