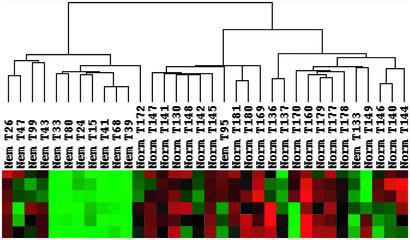
Figure 1.
NM and normal samples cluster independently by hierarchical clustering. Dendrogram generated by treeview (at top) reveals correlations between data sets for 34 specimens (middle) and identifies separate clusters for NM and normal muscles. The bottom part of the figure depicts signal strengths for a representative gene cluster, in which each row reflects the expression levels of one probe set across all samples. Color indicates relative signal levels, with red indicating the highest and green indicating the lowest expression.

