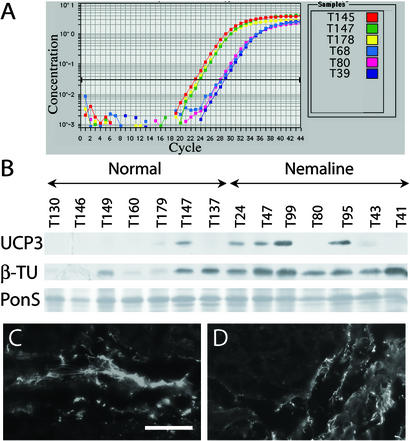
Figure 2.
Confirmatory studies of UCP3 and β-tubulin, at the transcript and protein levels. (A) UCP3 gene expression levels by quantitative reverse transcriptase PCR, for three representative normal (T145, T147, and T178) and NM (T68, T80, and T39) samples. UCP3 mRNA concentration is higher in normal than NM samples, and therefore peaks at an earlier cycle. (B) Immunoblotting reveals higher UCP3 protein levels in NM than in normal samples (Top). Specimens are indicated above. Ponceau S staining (PonS, Bottom) was used to ensure even loading of all protein samples. β-Tubulin also appears increased by immunoblotting in NM samples (β-TU, Middle). IF for β-tubulin in representative samples T146 (normal) (C) and T41 (NM) (D) reveals localization to connective tissue and not muscle fibers. (Bar = 50 μm.)

