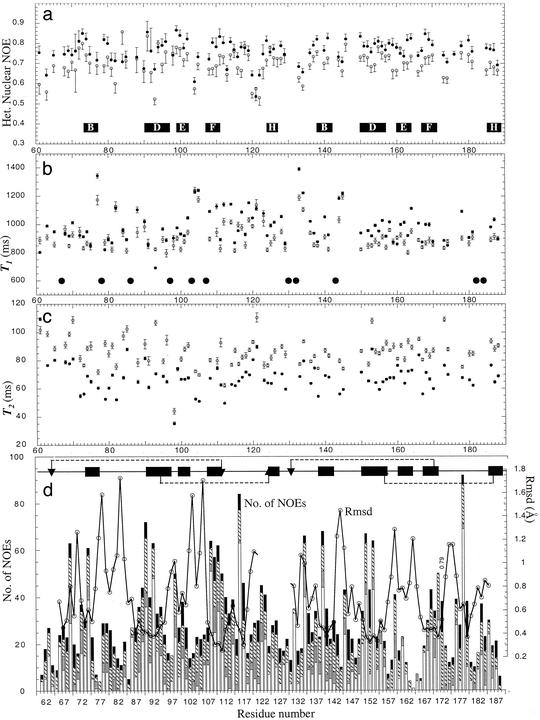
Fig 1.
Relaxation measurements and distance restraints. (a–c) 15N,1H NOEs, 15N T1s and 15N T2s, respectively, vs. aa number. Filled and open symbols with error bars derive from 800- and 600-MHz spectra, respectively. Black horizontal bars show extent and annotation of β-strands. Larger filled circles correspond to prolines. (d) Number of NOEs (left axis) as a stack plot vs. aa number. Vertical filled bars = (i − I + >4); hashed bars = (i − I + (2–4); gray bars = sequential; and open bars = intraresidue NOEs. Open symbols (right axis) show rmsds, based on Cαs of the structure closest to the mean, vs. aa number calculated for each module separately. Horizontal filled bars summarize 2° structure, with location of Cys and disulfides shown as arrows and dotted lines.

