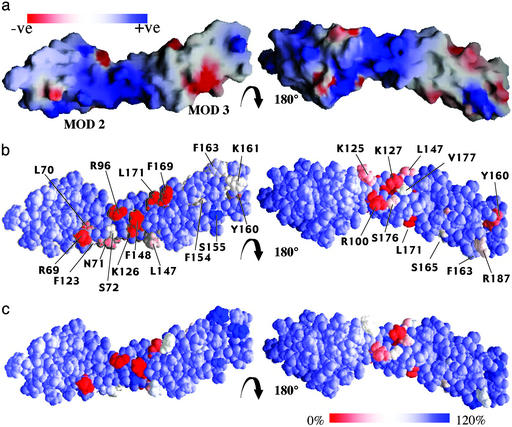
Fig 4.
Electrostatic surface representation of DAF∼2,3 and outcomes of mutagenesis. (a) Electrostatic surface representations: the Left view is the same as that used in Fig. 2 (but rotated −90° about an axis perpendicular to the page). Red is negative and blue is positive as indicated by the upper left bar (range 1.4–128 kT). (b) Surface views as in a to illustrate outcome of mutating the labeled individual residues (20). Percentage of wild-type AP regulatory activity remaining after substitution is color coded according to the color bar (lower right). (c) As in b, but this frame summarizes the effects of the same mutations on CP regulatory activity. All mutations were to Ala except N71K and S72F.

