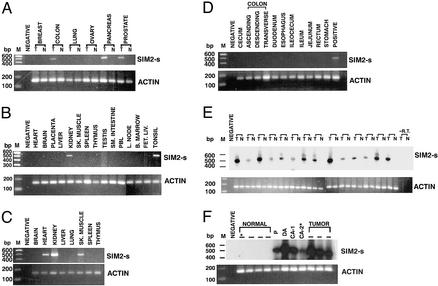
Figure 1.
Expression profile of SIM2-s. Random primed cDNAs were analyzed by RT-PCR. (A) Tumor (T) and normal (N) tissues (matched) from breast, colon, lung, ovary, pancreas, and prostate carcinomas; (B) CLONTECH pooled multiple normal tissue; (C) CLONTECH fetal tissue; (D) CLONTECH digestive tissue; (E) matched tumor and normal tissues from 14 independent colon carcinoma patients; and (F) cDNAs from normal colon, polyp (P), duodenal adenoma (DA) and colon adenoma (CA), and colon tumors were analyzed for SIM2-s and actin expression. PCR products in E and F were hybridized with an internal oligomer probe. *, Matched tissues from the same patient; M, 100-bp ladder; negative, template minus PCR control; positive, colon tumor cDNA; −RT, reverse transcriptase minus control. One representative experiment from three independent experiments is shown.

