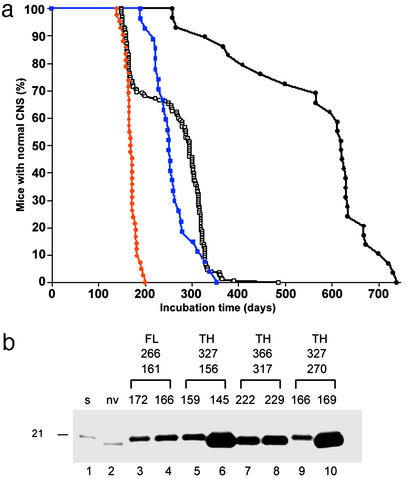
Figure 3.
Serial transmission of vCJD prions into Tg5378 mice. (a) Survival curve of Tg5378 mice inoculated with vCJD. The black line with the filled circles represents the first passage into Tg5378 mice, the black line with the open squares depicts the second passage, the blue line shows the third passage of the long-incubating substrain, and the red line illustrates the third passage of the short-incubating substrain. (b) Immunoblots of deglycosylated rPrPSc in selected brains from the third passage of vCJD into Tg5378 mice. The three sets of numbers above the immunoblot represent, from top to bottom, incubation times for first, second, and third passage. For the third passage, deglycosylated rPrPSc from brains of two different mice are shown. Deglycosylated rPrPSc from human patients with sCJD(MM1) (lane 1) and vCJD (lane 2) are depicted. Tg mice that were classified as short incubation time on second passage (lanes 3–6, red line in a) and as long incubation time on second passage (lanes 7–10, blue line in a). Deglycosylated rPrPSc has the electrophoretic mobility of either 21 kDa (lanes 3–5 and 9) or 19 kDa (lanes 6–8 and 10). The original vCJD prions used to inoculate the mice were either from the frontal lobe (FL) (lanes 3 and 4) or from the thalamus (TH) (lanes 5–10) of the human patient.

