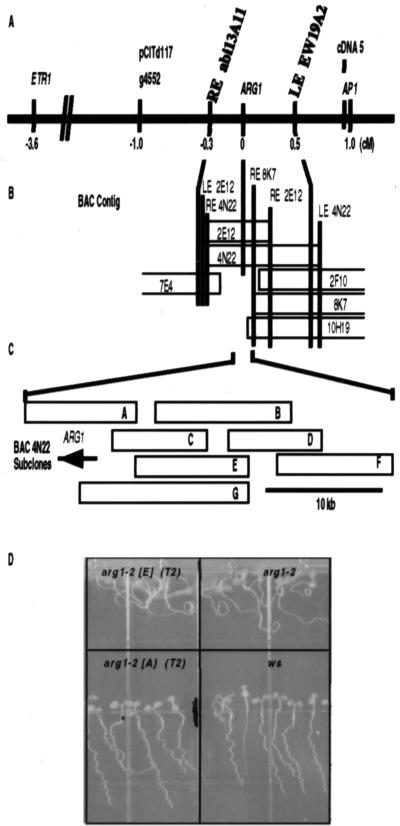
Figure 2.
Genetic and physical map of the genomic region spanning ARG1. (A) Genetic map of a region of chromosome 1 between the genes ETR1 and APETELA 1 (AP1). Genetic and molecular markers are listed above the solid line, whereas their distances (in cM) from ARG1 are listed below. The YAC contig described in ref. 47 stretches from the RFLP marker g4552 to AP1. ARG1 was mapped between the YAC-end markers RE abi13A11 and LE EW19A2 by RFLP analysis. (B) Depiction of the BAC contig (drawn to a cM scale) assembled to cover the chromosomal region between YAC-end markers RE abi13A11 and LE EW19A2. Vertical bars represent BAC- and YAC-end probes that hybridized to DNA isolated from the BAC clones (open rectangles). ARG1 was mapped on BACs 4N22 and 2E12 by RFLP analysis. (C) The relative positions of BAC 4N22 subclones (open rectangles labeled A–G). The ARG1 gene is represented by an arrow indicating the direction of its transcription. (D) Fragment A rescues the wavy-root growth phenotype of arg1–2. Wild-type WS seedlings (Lower Right), arg1–2 seedlings (Upper Right), T2 progeny of a fragment A-transformed arg1–2 plant (Lower Left), and T2 progeny of a fragment E-transformed arg1–2 plant (Upper Left) were subjected to the wavy-root growth assay described in Materials and Methods. The asterisk indicates a segregating T2 progeny that develops a mutant root-waving phenotype; others develop a wild-type root-wave phenotype that cosegregates with the transgene (not shown).

