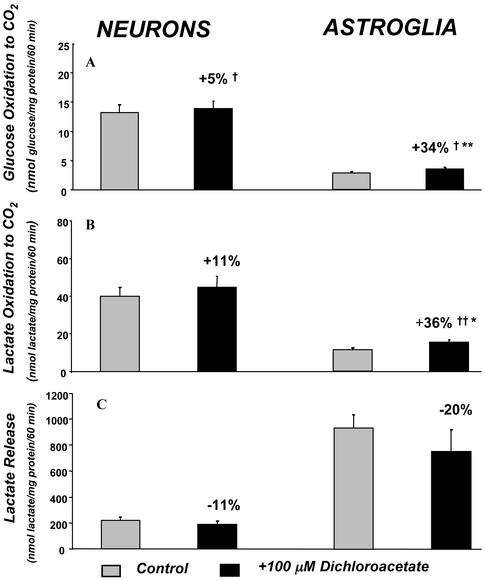
Figure 2.
Effects of 100 μM dichloroacetate on rates of glucose and lactate oxidation to CO2 and lactate release into extracellular medium by neurons and astroglia in vitro. Bar heights and error bars represent mean rates ± SEM of glucose oxidation to CO2 (A), lactate oxidation to CO2 (B), or lactate release (C) determined in four experiments, in each of which each point was determined in quadruplicate. †, P < 0.05; ††, P < 0.01, for comparison of absolute differences between control and dichloroacetate-treated groups. *, P < 0.05; **, P < 0.01, for comparisons between the logarithms of the percent differences between control and dichloroacetate-treated groups; the percent differences are the means of the individual percent differences in the experiments and not the percent difference between the means.

