
Figure 4.
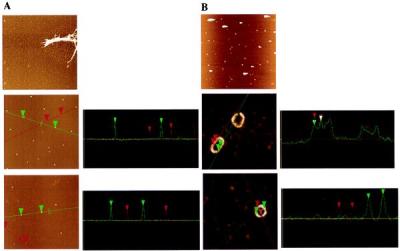
AFM images (and cross-sections) of oligomeric species from 200 μM α-synuclein incubations. (A Top) WT incubation (before sedimentation and gel filtration) showing fibrils and protofibril “spheres” (5-μm square). (Middle) 1:1 A53T/WT incubation after gel filtration showing “spheres” of 5.2–5.5 nm (green cursor and cross-section) and 2.6–3.6 nm (red cursor and cross-section) (2-μm square). (Bottom) 1:1 A30P/WT incubation after gel filtration showing spheres of 4.8–4.9 nm (green cursor and cross-section) and 3.3–3.5 nm (red cursor and cross-section) (2-μm square). (B Top) 1:1 A53T/WT (see A Middle), after incubation, showing rings (5-μm square; very bright features may be amorphous aggregates, with tails from AFM tip “skipping”). (Middle) Close-up of same sample (400-nm square) showing two ring types: circle and ellipse. The periodicity along the ellipse surface is shown in the cross-section to be regular (23 nm), with the maximum height of ca. 4 nm. (Bottom) Another circular ring in the same incubation (300-nm square), showing the diameter of ca. 50 nm and the difference between the maximum (3.6–4.1 nm) and minimum (2.1–2.2 nm) heights.