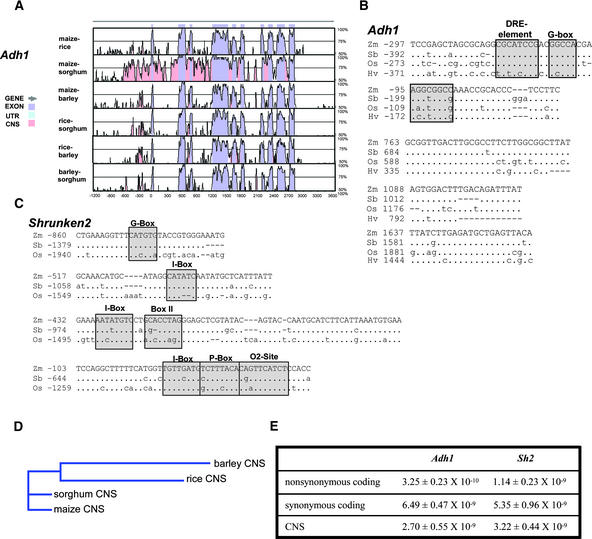
Figure 4.
CNS Evolution in Cereal Adh1 and Sh2 Genes.
(A) Graphic VISTA output obtained after comparison of the maize, rice, sorghum, and barley Adh1 genes (criteria of >70% identity with a window size of 20 bp). UTR, untranslated region.
(B) Sequence alignments and positions within the Adh1 gene for the five CNS conserved among Adh1 genes from all four species (Hv, barley; Os, rice; Sb, sorghum; Zm, maize). Dots indicate nucleotide identity, nucleotide substitutions are given in lowercase letters, and dashes show gaps introduced by the alignment algorithm. Boxed and shaded regions indicate sequences similar to known promoter regulatory elements as predicted by the Search for CARE tool at http://oberon.rug.ac.be:8080/PlantCARE/index.html (Lescot et al., 2002), with the shaded sequence from −201 to −194 of the maize Adh1 promoter corresponding to the sequences that show differential biochemical footprints when Adh1 expression is induced by hypoxia (Paul and Ferl, 1991).
(C) Sequence alignments and positions for the four CNS conserved among the orthologous Sh2 genes from maize, rice, and sorghum. Details and symbols are as in (B).
(D) Predicted phylogenetic tree using the combined Adh1 and Sh2 CNS alignments from (B) and (C).
(E) Estimates of nucleotide substitution rates (substitutions per site per year) for coding sequences and CNS from the Adh1 and Sh2 genes compared in (A) to (C).

