
Figure 4.
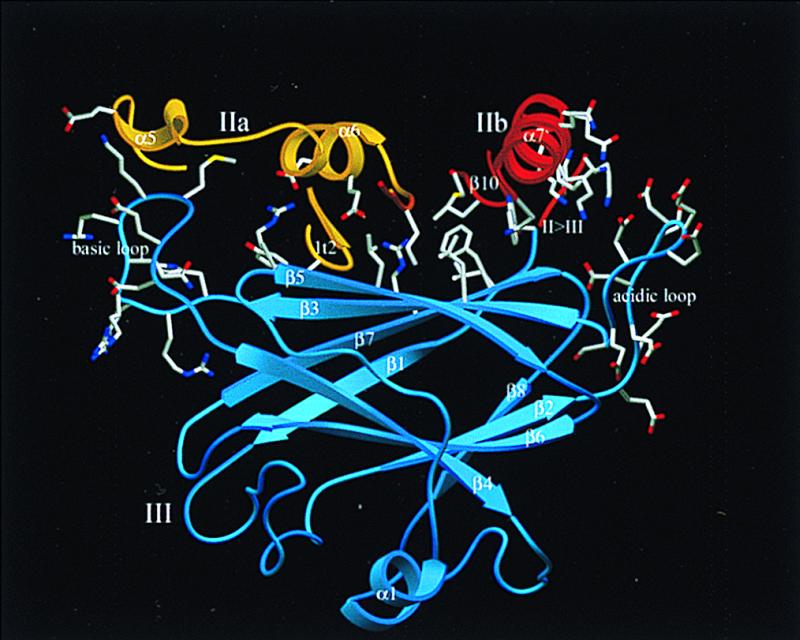
Ribbon plot of domain dIII (blue) and contacting segments from subdomains dIIa (gold) and dIIb (red). The side chains of the right-side acidic loop and of the left-side basic loop, and some polar and hydrophobic residues forming the polar (center, left) and hydrophobic (center, right) interface between both catalytic subdomains and domain dIII are given. Reference orientation is as in Fig. 1. The figure was made with setor (34).