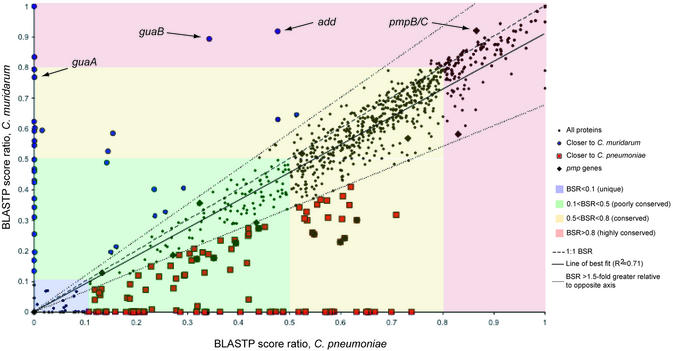
Figure 1.
Plot of BSRs of C.caviae proteins against C.pneumoniae and C.muridarum. For each predicted C.caviae protein, BLASTP P-values against itself and for the most similar proteins in C.pneumoniae and C.muridarum are obtained. The P-values are converted using a –ln function and the BSR calculated using the C.caviae self-alignment value. Each ratio pair (C.pneumoniae:C.caviae and C.muridarum:C.caviae) is then plotted for each C.caviae gene. Certain classes of similarity are highlighted—regions of the plot with highly conserved proteins (BSR ≥ 0.8) in red, conserved (0.5 < BSR < 0.8) in yellow, poorly conserved in green (0.1 < BSR < 0.5) and non-conserved (unique) in blue (BSR <0.1). Where the ratio of the score for a gene in one genome was at least 1.5-fold greater than the other (as delineated by the dotted lines), proteins have been marked as red squares (closer to C.pneumoniae) or blue circles (closer to C.muridarum). The pmp proteins are also highlighted (black diamond), showing their wide distribution of similarity and particularly pmpB/C, unusual for its high conservation in other chlamydial genomes. The positions of members of the guaBA-add gene cluster, found in the C.caviae replication termination region, are also indicated.

