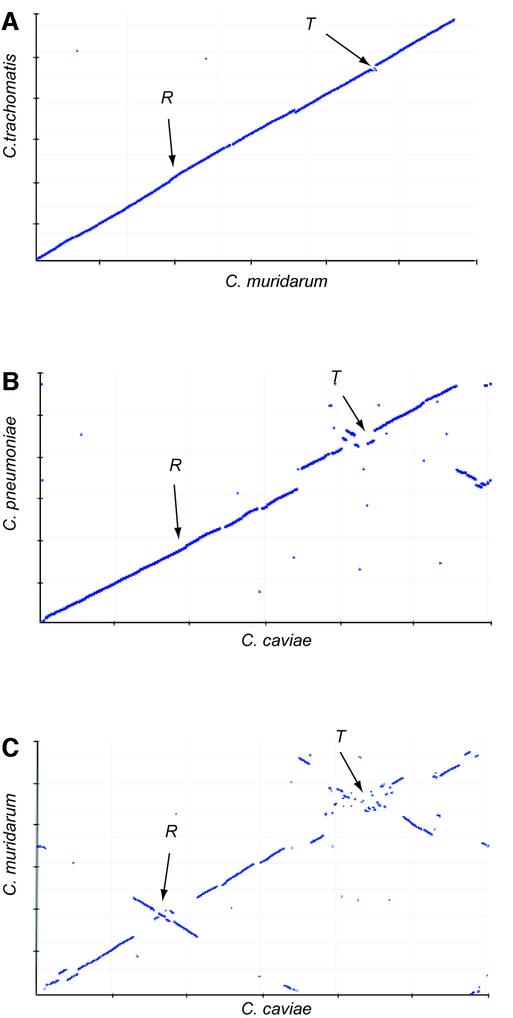
Figure 3.
Comparison of chromosomal synteny in the Chlamydiaceae. (A) Chlamydia trachomatis versus C.muridarum; (B) C.pneumoniae versus C.caviae; (C) C.muridarum versus C.caviae. Each panel is the plot of the most similar proteins (using BLASTP P-values), ordered by chromosomal position for each genome pair. Axes are marked with 200 kb graduations. R and T are the locations of the origin of replication and the termination region, respectively. Genomes have been rotated so that the replication origin is at ∼275 kb and the termination region at ∼850 kb.

