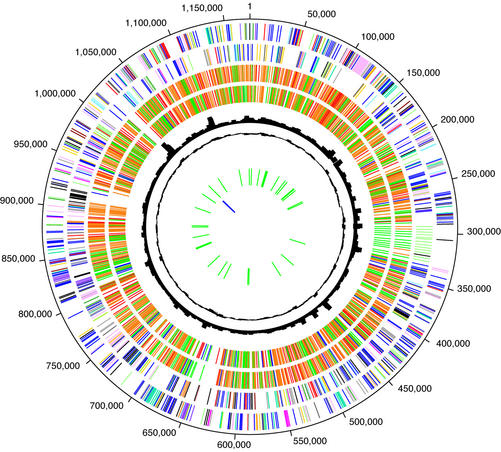
Figure 4.
Circular representation of the C.caviae chromosome. Data are from outermost circle to innermost. Circles 1 and 2: tick marks represent predicted coding sequences on the plus strand (circle 1) and minus strand (circle 2) colored by cellular role. Role categories and colors are as follows: amino acid biosynthesis, violet; biosynthesis of cofactors, prosthetic groups and carriers, light blue; cell envelope, light green; cellular processes, red; central intermediary metabolism, brown; DNA metabolism, gold; energy metabolism, light gray; fatty acid and phospholipid metabolism, magenta; protein synthesis and fate, pink; biosynthesis of purines, pyrimidines, nucleosides and nucleotides, orange; regulatory functions and signal transduction, olive; transcription, dark green; transport and binding proteins, blue–green; other categories, salmon; unknown function, gray; conserved hypothetical proteins, blue; hypothetical proteins, black. Circles 3 and 4: genes in C.caviae that are homologous to genes in C.pneumoniae (circle 3) and C.muridarum (circle 4) colored by normalized BLAST score: 0.8 < score, red; 0.5 < score < 0.8, yellow; 0.1 < score < 0.5, green; score < 0.1, blue. Circle 5: chi-square of trinucleotide skew. Circle 6: codon adaptation index (CAI) score for each gene. Circle 7: predicted tRNAs. Circle 8: predicted rRNAs.

