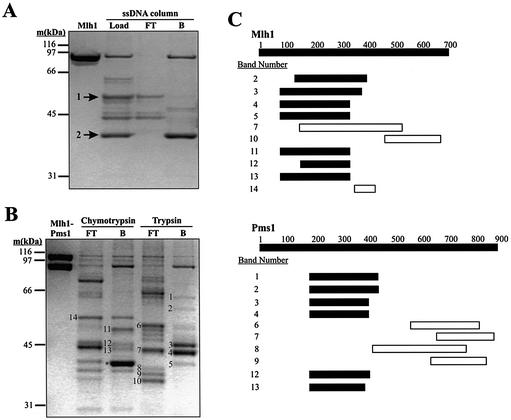
Figure 1.
DNA binding by proteolytic fragments of Mlh1 and Pms1. (A and B) 10% NuPAGE Bis-Tris SDS–polyacrylamide gels stained with Coomassie brilliant blue R-250. (A) Purified Mlh1 was digested with chymotrypsin and the reaction products subjected to ssDNA affinity chromatography as described in Materials and Methods. The first lane shows 1.6 µg of purified Mlh1. The lane designated Load shows 1% (∼1 µg) of the products of the chymotrypsin digestion loaded on the ssDNA column. The lane designated FT (‘Flow Through’) shows ∼0.5 µg of protein that flowed through the ssDNA column, while the lane designated B (‘Bound’) shows ∼1.5 µg of Mlh1 fragments retained on the column and then eluted with 500 mM NaCl. Cleavage at a single major chymotrypsin cleavage site yields the two fragments labeled by arrows. Mass spectrometric analysis demonstrated that fragment 1 consists of amino acids 344–769 and fragment 2 consists of amino acids 1–343. (B) Purified Mlh1–Pms1 was digested with chymotrypsin and trypsin and the reaction products were subjected to ssDNA affinity chromatography as described under Materials and Methods. The first lane, Mlh1-Pms1, shows 2 µg of purified Mlh1–Pms1. All other lanes contain ∼1 µg of protein. FT, 5% of the ssDNA column flow-through from the proteolysis reactions; B, 10% of the peak fraction of proteolysis reaction products retained on the ssDNA affinity column and eluted with 500 mM NaCl. Numbered bands were excised from the gel, subjected to in-gel digestion with trypsin and analyzed by MALDI mass spectrometry. The band labeled with * is fragment 2 from (A), representing amino acids 1–343 of Mlh1. Fragment 1 from (A) is most likely band 14, although we did not confirm this. Other bands were also selected for analysis but did not yield interpretable mass spectrometry data. In general, we concentrated on the analysis of the smaller bands in lanes B because these were more informative for defining the DNA binding region. In (A) and (B) molecular weight standards were from Bio-Rad (broad range). (C) Peptide maps of the numbered bands in (B) were obtained by mass spectrometry. Labels on the Mlh1 and Pms1 bars represent amino acid number. Solid bars represent the range of peptides identified in the indicated fragments that were retained on the ssDNA affinity column. Likewise, open bars represent the range of peptides identified in the indicated fragments that flowed through the ssDNA affinity column. Several bands yielded peptides from both Mlh1 and Pms1 due to co-migration of proteolytic fragments. Note that open and closed horizontal bars do not represent absolute boundaries of the proteolytic fragments excised from the gel in (B). Rather, they indicate the range of peptides within the fragments, as identified by mass spectrometry. Also note that Mlh1 band 7 contains peptides within the NTD, yet this proteolytic fragment did not bind to the affinity column. We are not sure why this is the case; perhaps this fragment is folded in a manner that eliminates DNA binding.

