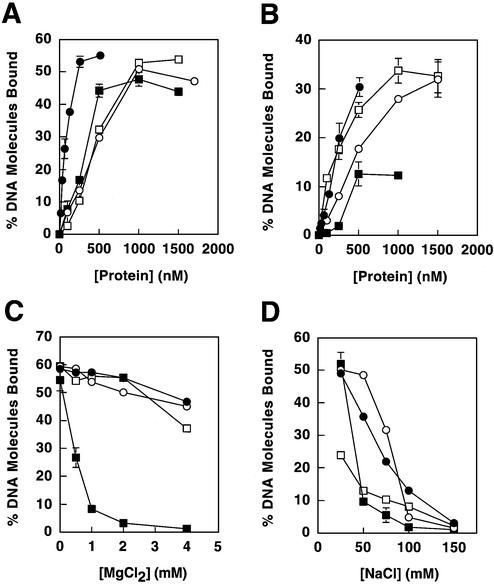
Figure 3.
DNA binding of MMR proteins. Proteins examined were Mlh1–Pms1 (closed circles), full-length Mlh1 (open circles), Mlh1(343) (closed squares) and Pms1(396) (open squares). (A) Binding to the double-stranded plasmid pGBT9. (B) Binding to single-stranded poly(dT). (C) Effects of MgCl2 on binding to pGBT9. (D) Effects of NaCl on binding to pGBT9. In binding assays that employed a constant protein concentration (C and D), concentrations utilized were 100 nM for Mlh1–Pms1 and 500 nM for Mlh1, Mlh1(343) and Pms1(396), such that initial levels of DNA binding were below saturation. Binding reactions for Mlh1(343) were performed without MgCl2 (except in C), due to the low affinity of this protein for DNA in the presence of MgCl2. Protein–DNA binding is presented as percent DNA molecules bound (percentage of total DNA substrate in a given sample that is protein bound). Error bars represent standard errors of the mean for two to three independent experiments. Error bars are included for all data, but are not visible on some points because the error is smaller than the symbol itself.

