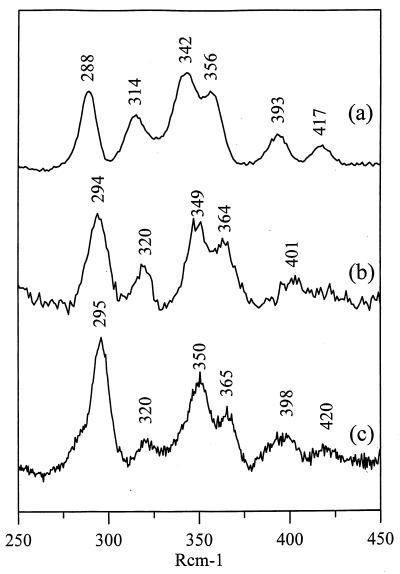
Figure 4.
Comparison of the low-temperature resonance Raman spectra of the [2Fe-2S]2+ clusters in as-isolated NifU (a), reconstituted NifU-1 (b), and human ferrochelatase (c). All samples (2–4 mM in 100 mM Tris·HCl, pH 7.8, buffer) were in the form of concentrated frozen droplets maintained at 18 K. The spectra were recorded by using 488-nm excitation with 70-mW of laser power at the sample and are the sum of 19, 90, and 80 scans for a, b, and c, respectively. Each scan involved advancing the spectrometer in 1 cm−1 increments (0.5 cm−1 for c) and photon counting for 1 s/point with 6-cm−1 resolution.

