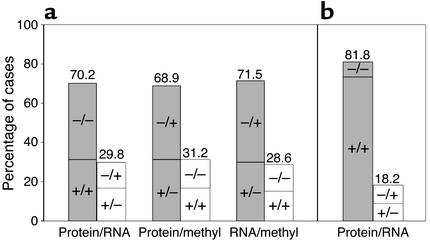
Figure 4.
Concordance analysis between protein expression, mRNA expression, and promoter methylation of hMLH1 (a) and hMSH2 (b). The percentage of cases is indicated on the y axis, whereas the type of comparison is shown on the x axis. + indicates positive protein expression (protein), positive mRNA expression (RNA), and hypermethylation (methyl) of the promoter. Numbers above bars indicate percentages of the total concordant group (gray sections) and nonconcordant group (white sections). P = 0.001 for association between protein expression, mRNA expression, and promoter methylation in the hMLH1 gene; P = 0.002 for association between protein expression and mRNA expression in the hMSH2 gene.

