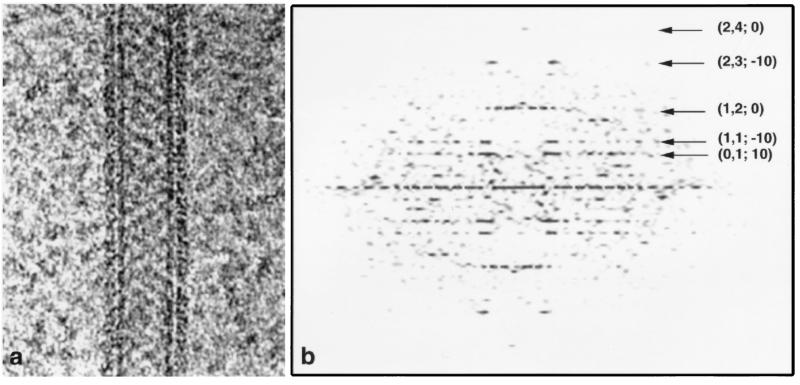
Figure 3.
Electron micrograph (a) and raw Fourier transform (b) from a tube of the (−20, 10) helical family. (a) The tube, embedded in ice, is suspended over a hole in a carbon support film. The RNAP molecules are visible as a crystalline array surrounding the cylindrical lipid bilayer tube. The edge views of the head groups of the phospholipid bilayer forming the tube give rise to the dark vertical lines. (b) In the Fourier transform calculated from the raw image (uncorrected for distortions), the indices (h, k, and n) for the major layer lines are shown, where h and k are indices of corresponding surface lattice lines and n is the Bessel order of the layer lines (16).

