FIG. 6.
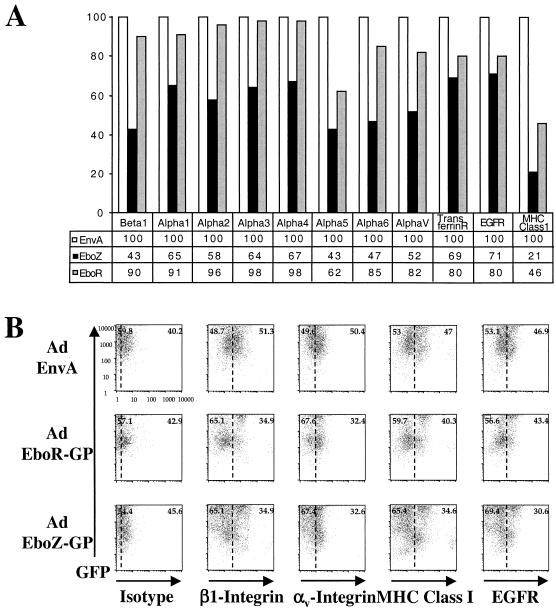
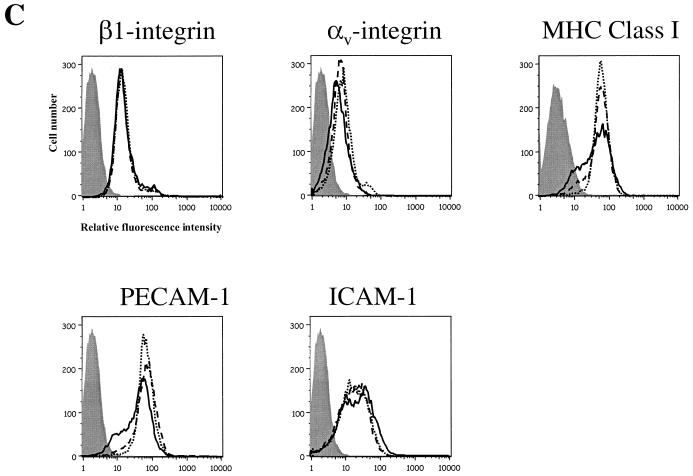
Expression of Ebola virus GP induces down-modulation of cell surface molecules. (A) At 48 h after transfection with pCB6-EboZ-GP, -EboR-GP, or -ASLV-A-EnvA, 293T cells were detached from the tissue culture plates, pooled with already-floating cells, and incubated with monoclonal antibodies directed against a number of integrin subunits as well as other common cell surface markers. Flow-cytometric analysis was then performed using secondary antibodies conjugated with fluorescein. Results are presented percentages of the mean channel fluorescence (MCF) compared to that for EnvA-transfected cells. Data are representative of multiple independent experiments. (B) Vero cells transduced at an MOI of 10 with Ad/EnvA Ad/EboR-GP, or EboZ GP were collected at 48 h postinfection. Cells were incubated with monoclonal antibodies to an isotype control, β1-integrin, αv-integrin, MHC-I, or EGFR and a secondary antibody conjugated to Cy5 and assayed by flow cytometry for GFP expression (FL1; y axis) or cell surface markers (FL4; x axis). Dotted lines, estimated MCF of expression for mock-transduced cells (C) HUVEC transduced at an MOI of 10 with Ad/EboZ-GP (solid line), Ad/EboR-GP (dashed line), or Ad/EnvA (dotted line) were collected 24 h postinfection. Cells were incubated with monoclonal antibodies to isotype controls (shaded histograms), β1-integrin, αv-integrin, MHC-I, or PECAM and a secondary antibody conjugated to Cy5 and assayed by flow cytometry. In HUVEC, unlike HPAEC, which showed up-regulation of some markers in response to adenovirus infection, there was no difference between nontransduced and Ad/EnvA-transduced cells for any of the markers (data not shown). Data are representative of three independent experiments.


